
Healthcare providers are experiencing increasing financial pressure, with PwC projecting an 8% year-on-year medical cost trend in 2025 for the Group market, driven by inflationary pressure, prescription drug spending, and behavioral health utilization (PwC, February 2025). Meanwhile, mergers and acquisitions in the healthcare sector demonstrated continued resilience in 2024 despite a 9% decline in deal volume from 2023 (Fierce Healthcare, January 2025). In this complex financial landscape, understanding how Case Mix Index (CMI) impacts contract negotiations has become crucial for hospital administrators seeking to secure favorable reimbursement terms with payers.
Understanding Case Mix Index and Its Financial Implications
Case Mix Index is a metric that reflects the diversity, complexity, and severity of patients treated at a healthcare facility. Used by the Centers for Medicare and Medicaid Services (CMS) to determine hospital reimbursement rates for Medicare and Medicaid beneficiaries, CMI is calculated by adding the relative Medicare Severity Diagnosis Related Group (MS-DRG) weight for each discharge and dividing by the total number of Medicare and Medicaid discharges in a given period (Definitive Healthcare, 2024).
Key CMI Metrics Hospital Administrators Should Monitor
- Overall Facility CMI: The aggregate measure of patient complexity across your entire facility.
- Service Line CMI: A breakdown of CMI by clinical service lines to identify high-complexity areas.
- Payer-Specific CMI: Tracking CMI variations across different payer populations.
- CMI Trend Analysis: Historical tracking of CMI changes over time.
- Benchmark Comparison: How your facility's CMI compares to peer institutions.
These metrics carry significant financial implications, as increased CMI results in higher reimbursement and lower adjusted cost per patient per day, which equates to significant revenue enhancement for hospitals. It also positively impacts Observed Over Expected (O/E) ratios for quality scores, including mortality and expected complications.
The Financial Impact of Case Mix Index: Statistics and Reimbursement Effects
Direct Revenue Impact
The financial implications of Case Mix Index are substantial and measurable. Hospitals with the highest CMIs in the U.S. have values ranging from 0.56 to 5.89, with an average CMI of 1.84 (Definitive Healthcare, 2025). Specialized facilities performing complex procedures like spinal surgery, cardiac surgery, and orthopedic surgery typically have higher CMI values, directly translating to higher revenue since Medicare reimbursement is calculated based on these values.
A historical analysis demonstrates the powerful financial effect of even small CMI changes. In 1984, Medicare paid hospitals 5.6% more per admission than planned because the Case Mix Index increased 9.2% when only a 3.4% increase had been projected (NIH PMC, 1986). This unexpected growth in CMI created a substantial windfall for hospitals that effectively documented patient complexity.
More recently, healthcare facilities have shown that focused CMI improvement initiatives yield impressive financial returns. Some hospitals implementing targeted documentation programs have seen CMI increases of 14.3% in the first year and an additional 23% increase after continued focus, directly boosting reimbursement (The Shift, 2023).
The CMI-Denials Connection
The relationship between CMI and claims denials creates a critical financial pressure point for hospitals. According to recent data, 41% of healthcare organizations experience denial rates of at least 10%, with some facing rates exceeding 15%, representing substantial lost revenue (Experian Health, 2025). Initial claim denials reached 11.8% in 2024, up from approximately 10.2% in prior years (OS Healthcare, 2025). Many of these denials directly relate to documentation deficiencies that also impact CMI.
A comprehensive study by Premier Inc. revealed that nearly 15% of medical claims submitted to private payers for reimbursement were initially denied, with Medicare Advantage plans denying 15.7% and Managed Medicaid denying 15.1% of claims (TechTarget, 2024). These denial patterns closely align with cases where CMI documentation may be questioned.
The cost of addressing these denials is substantial. Hospitals fighting denials spend an average of $47.77 per Medicare Advantage claim and $43.84 per claim across all private payers in administrative costs alone (STAT News, 2024). This expense compounds the financial impact of inadequate CMI documentation.
Documentation Quality: The Common Denominator
Poor documentation affects both CMI accuracy and denial rates through the same mechanism. Research indicates that private hospitals increased their average CMI nearly three times more than public hospitals over the same period, not because they treated sicker patients, but primarily due to better documentation and coding practices (NIH PMC, 2014).
The connection between documentation and denial prevention is equally clear. The Journal of Managed Care & Specialty Pharmacy reports that the burden of denied claims totals around $260 billion annually, with nearly half of providers (46%) identifying missing or inaccurate information as the primary cause for denials (Experian Health, 2024).
Impact on Contract Negotiations
The CMI's influence extends directly to contract negotiations with private payers. Analysis shows that diagnosis-related group (DRG) weight, the foundation of CMI, explains approximately 37% of cost variability in hospitalization expenses (NIH PMC, 2024). This figure provides leverage in negotiations, allowing hospitals to demonstrate their actual care complexity.
The challenge has intensified in recent years as relationships between health systems and health plans have worsened, with 80% of surveyed CFOs blaming health plans for "intentional or systematic efforts to increase denials," forcing 75% of healthcare organizations to add financial services staff to manage the process (HFMA, 2024).
Root Cause Analysis: Factors Affecting Your CMI
Documentation Accuracy
When a facility correctly uses technology to produce accurate documentation and coding accuracy, it can provide more precise reimbursement claims. A comprehensive root cause analysis should include a review of physician documentation patterns, an audit of coding practices, an assessment of clinical documentation improvement (CDI) program effectiveness, and an evaluation of EMR templates and tools that support accurate diagnosis capture.
Service Mix Evaluation
Your hospital's CMI is directly influenced by the types of services provided. Many hospitals with high CMI values specialize in spinal surgery, general or orthopedic surgery, or cardiac procedures, which involve complicated patient procedures and are reimbursed at a higher rate. Analyze your current service mix to determine which service lines contribute most positively to your CMI, opportunities to expand high-complexity services, and areas where your facility has unique expertise that could justify higher reimbursement.
Payer Mix Analysis
Different payers have varying impacts on your overall CMI. Publicly insured patients (Medicare and Medicaid) often have different documentation and coding requirements than commercial payers.
Team Structure Optimization for CMI Management
Create a dedicated CDI team including physician champions who understand documentation importance and can influence peers, CDI specialists who review documentation concurrently and query physicians, coders who translate documentation into accurate codes, and data analysts who track CMI metrics.
Integrate CMI improvement with revenue cycle management across pre-service (incorporating CMI considerations into service line planning), point-of-service (real-time documentation tools), post-service (reviewing documentation before submission), and financial analysis (incorporating CMI into performance dashboards).
Technology Integration Strategies for CMI Optimization
EMR Optimization
Your EMR should support accurate documentation through smart templates that prompt physicians to document key clinical indicators, embedded MS-DRG criteria within workflows, and real-time alerts for potentially missing documentation.
AI and Analytics Tools
Leverage natural language processing to identify documentation gaps, predictive analytics to forecast CMI trends, and comparative benchmarking against peer institutions.
Staff Training Approaches for CMI Improvement
The most effective way to improve CMI is through thorough documentation training and consistent follow-through. Develop physician training covering new provider onboarding, specialty-specific training, and regular updates on requirements and metrics. Invest in coding staff through certification support, regular education on coding guidelines, and specialty training in complex service lines.
Performance Measurement Frameworks for CMI
Establish a dashboard tracking overall CMI by month/quarter/year, CMI by service line, documentation compliance rate, query response rate, and CMI impact on reimbursement. Implement monthly CMI review meetings, quarterly trend analysis, and annual strategic planning that incorporates CMI goals.
Current Industry Trends in CMI and Contract Negotiations
Healthcare continues shifting toward value-based care models, making CMI increasingly important for risk adjustment and resource allocation. Payer scrutiny is increasing, with some providers reporting payers preauthorizing treatment plans but later denying payment. Ongoing inflationary pressures make effective CMI management and favorable contract negotiations even more critical, and price transparency data presents a valuable asset for negotiation as access to comparative data changes the negotiation landscape.
Leveraging CMI in Contract Negotiations
Preparation Strategies
Providers should start preparing at least 12 months before the contract renewal date, gathering data on current reimbursement rates, analyzing payer performance, and understanding market trends. When preparing for negotiations, analyze historical CMI performance, benchmark against peers, calculate the financial impact of CMI changes, and identify service line strengths.
Effective Negotiation Approaches
Use your CMI data to demonstrate the complexity of your patient population, highlight quality outcomes connected to CMI, show cost efficiency in managing complex cases, and present trend analysis to support future projections. A transparent, data-driven strategy creates an opportunity for building a strong partnership with the payer based on mutual respect and understanding.
How Cofactor Can Transform Your CMI Management and Contract Negotiations
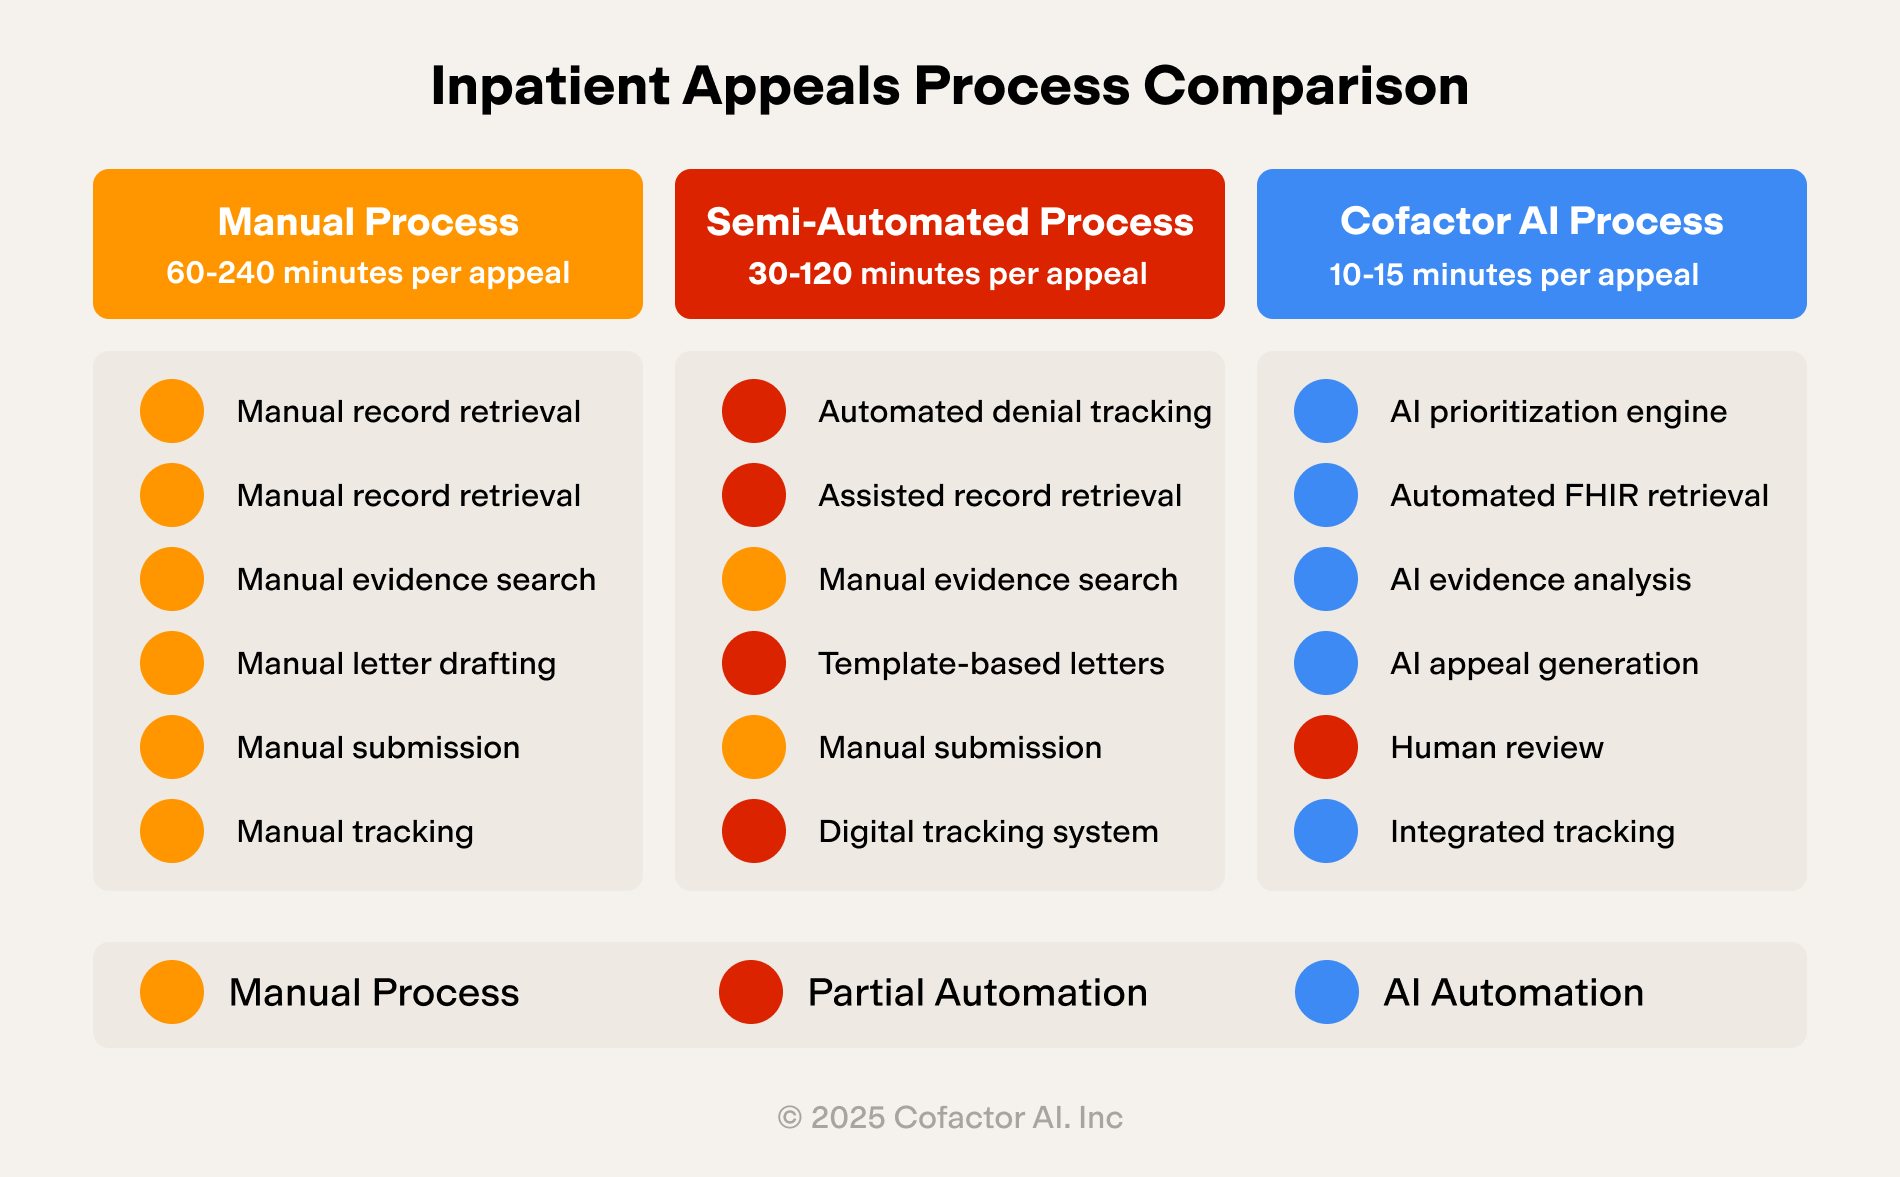
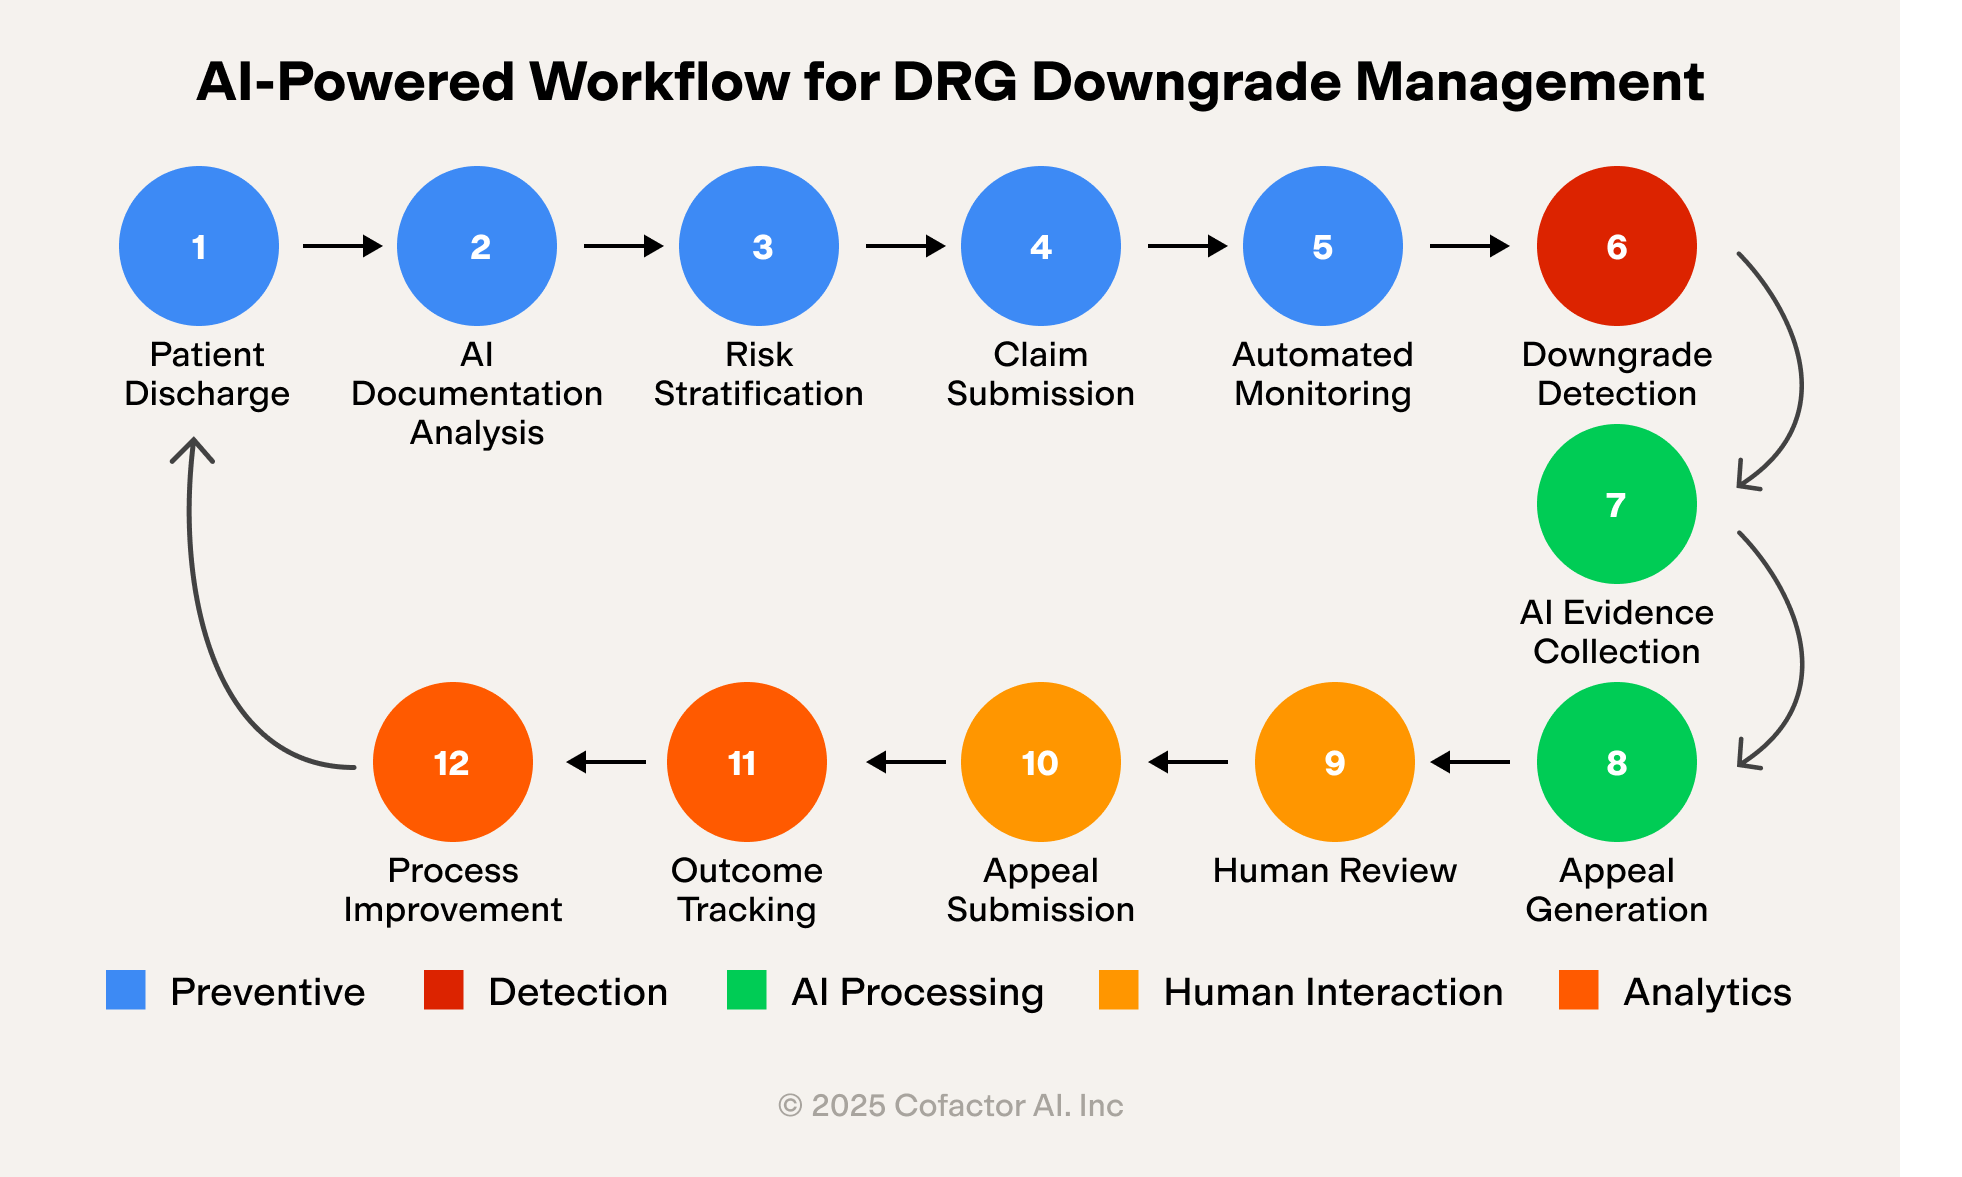
Cofactor's AI-powered platform streamlines the entire denials management process, analyzing and prioritizing denials based on financial impact, appeal deadline, and likelihood of overturn. When a denial occurs due to CMI-related documentation, our system automatically retrieves relevant clinical documentation through FHIR integration, analyzes payer policies and coding standards, and generates a comprehensive appeal letter with appropriate citations.
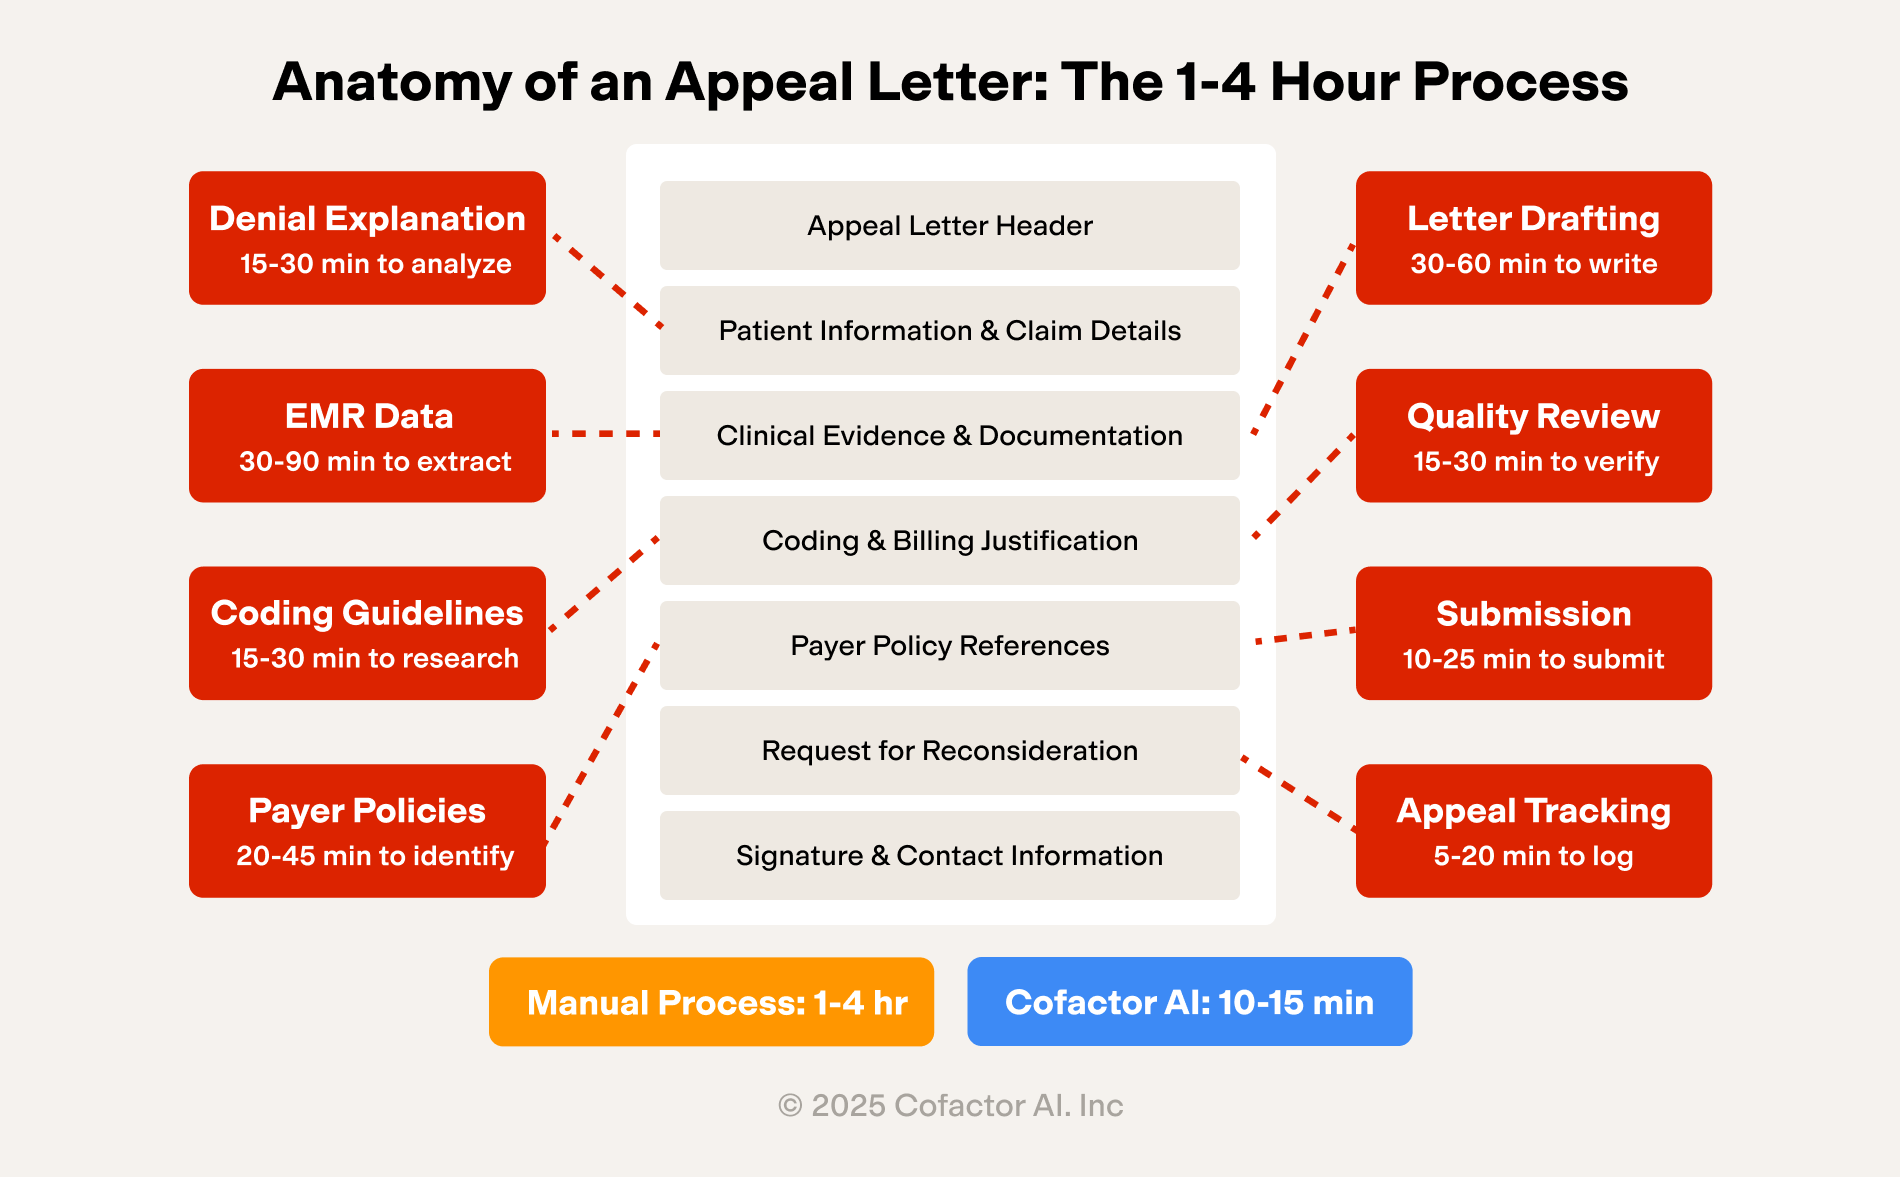
Our platform provides pattern recognition that identifies emerging denial trends, predictive models to estimate overturn probability by payer, and data-driven insights to guide prioritization. This transforms what typically takes 1–4 hours per appeal into a process requiring just 10–15 minutes of staff time, freeing your team to focus on strategic initiatives like CMI optimization and contract preparation.
Conclusion: Maximizing Hospital Revenue Through Strategic CMI Management
Case Mix Index is far more than a clinical metric, it's a powerful financial lever that directly impacts contract negotiations with payers. By understanding the relationship between CMI and reimbursement, implementing strategic improvements to documentation and coding, and leveraging advanced technologies, hospital administrators can transform their approach to payer contracts.
As healthcare faces continued financial pressures, effective CMI management represents one of the most significant opportunities for hospitals to secure fair reimbursement that reflects the true complexity and quality of the care they provide.



.svg)